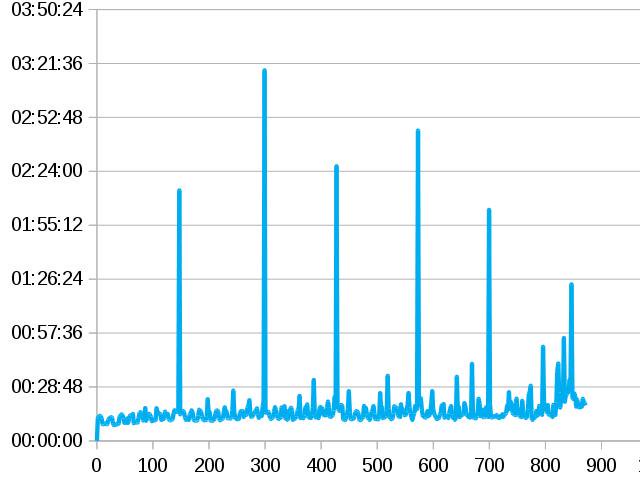
Progression chart This chart represents the duration of my laps, below is the distance in km. One can clearly spot the 5 nights (two hours or more) and the ugly big slow down at the end, something to be ashamed of, with all the stupid nonsense breaks stuck in it. 640 × 480 — 34.0 KB