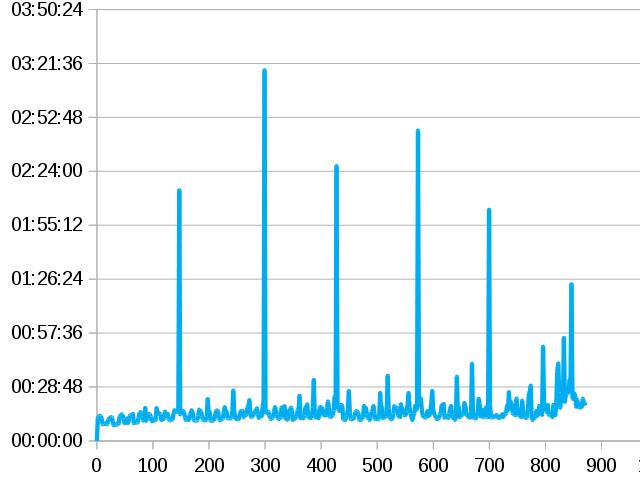
This chart represents the duration of my laps, below is the distance in km. One can clearly spot the 5 nights (two hours or more) and the ugly big slow down at the end, something to be ashamed of, with all the stupid nonsense breaks stuck in it.
Progression chart
Page generated by UWiKiCMS 1.1.9 on Fri Feb 06 2026.
Copyright © 2026 Christian Mauduit. Permission is granted to copy, distribute and/or modify this document under the terms of the GNU Free Documentation License, Version 1.2 or any later version published by the Free Software Foundation; with no Invariant Sections, no Front-Cover Texts, and no Back-Cover Texts.
Updated on Fri Feb 06 2026.
