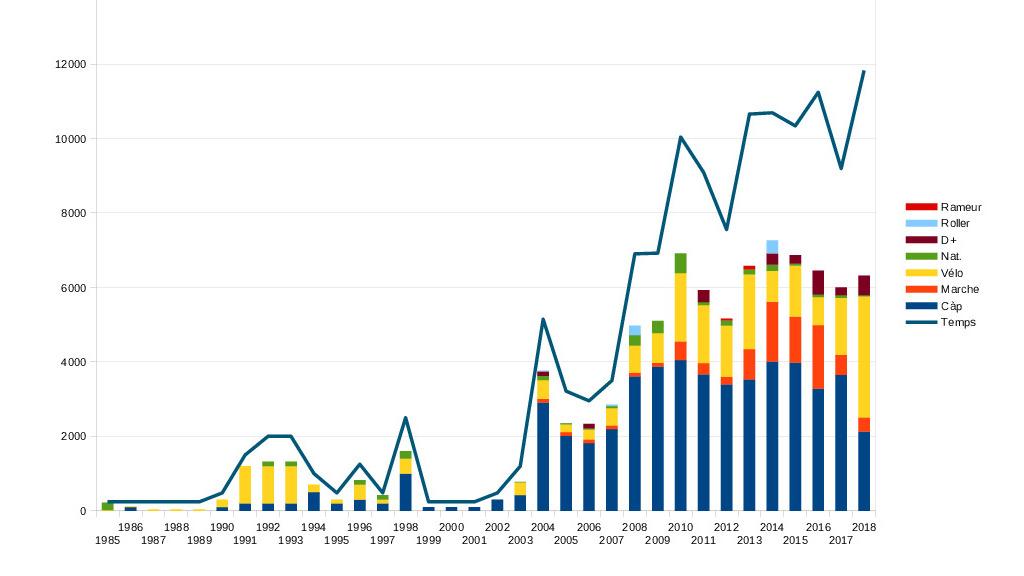
Chart representing the "effort" I'm putting into that thing, year after year. Miles on the bike need be multiplicated by 5, and those swimming divided by 4. The black line on top is the time I spent, in hours. The unit is a bit strange, basically when hitting 10000 it corresponds to 1000 hours. This because this way it fits well on the graph, as 10000k in 1000 hours is realistic.
Global chart
Page generated by UWiKiCMS 1.1.9 on Wed Apr 29 2026.
Copyright © 2026 Christian Mauduit. Permission is granted to copy, distribute and/or modify this document under the terms of the GNU Free Documentation License, Version 1.2 or any later version published by the Free Software Foundation; with no Invariant Sections, no Front-Cover Texts, and no Back-Cover Texts.
Updated on Wed Apr 29 2026.